This guide will help you get started debugging your app and scripts running on the video player.
Enable web inspector
On the video player on-screen menu or on the web administration, go to "System settings", "Web browser" and enable "Web inspector".
When enabled, the player listen for debugging clients on port 9222.
Security Implications
Since the debugger has full access to the player execution environment, a malicious actor able to
connect to this port may be able to execute arbitrary code.
It is important to understand the security implications of exposing the debugger port on public
and private networks.
Exposing the debug port publicly is unsafe!
Debug content on your video player from your development machine
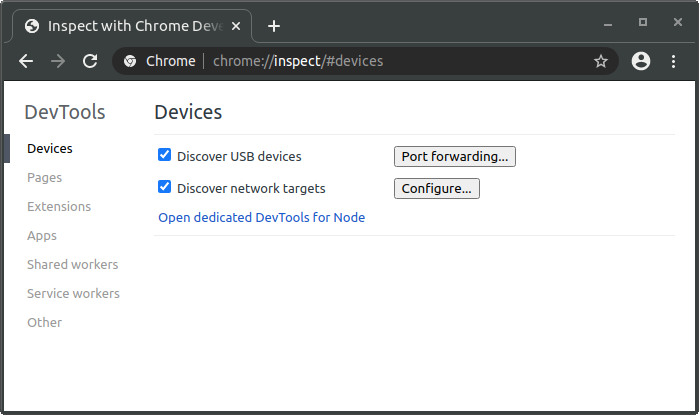
- Using Chrome or Chromium, go to
chrome://inspect#devices

-
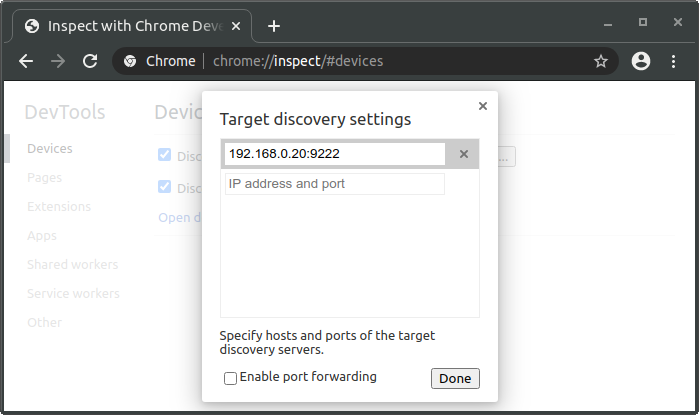
Make sure that the Discover network targets is enabled and click on Configure....
-
Add a new target using the video player IP address and port 9222.
On the following example, the video player IP address is 192.168.0.20.
You can get your player IP address by pressing the infrared remote control information button "i" or using the LCD screen if available (click and rotate the knob).

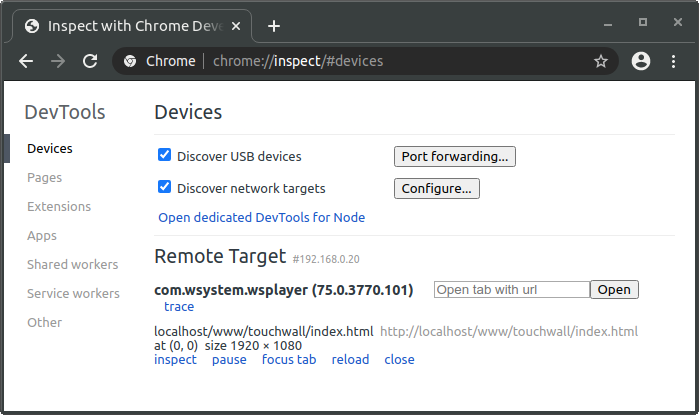
- You should now see the video player in the device list. You can then click on inspect to start debugging.
